
What Are IoT Devices for Energy Monitoring?
Energy costs often come from small, overlooked patterns: a compressor running after closing, a heater cycling in an empty room, or equipment drawing power overnight. Iot Devices For Energy Monitoring make these patterns easier to see. They use connected meters, sensors, and gateways to collect information about electricity use and send it to a dashboard. Some systems report whole-building consumption; others track individual circuits or machines. The level of detail depends on the hardware and installation.
That information can help facility teams compare usage across shifts, spot unusual changes, and check whether efficiency upgrades are working. For example, a live power reading may show that a ventilation fan continues running after staff leave. Useful, and specific. Still, a dashboard alone does not reduce consumption; people need to interpret its readings and take appropriate action. Sensor placement, data intervals, network reliability, and calibration all affect what the numbers can tell you. A sudden spike could indicate a fault, but it might also reflect normal production.
This guide explains the main device types, how they communicate, and where each approach may fit. It also considers data security, installation needs, and practical limits. No system is perfect. Readings can be incomplete, and savings should be verified against a sensible baseline rather than assumed. The goal is clearer decisions, not simply more data.
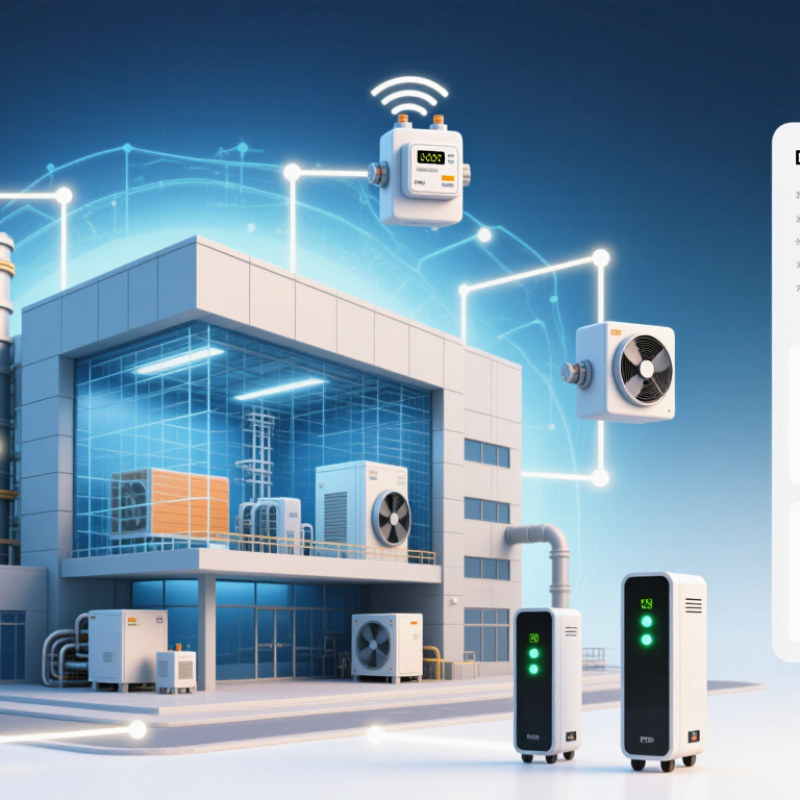
Definition and Scope of IoT Devices for Energy Monitoring
IoT devices for energy monitoring are connected instruments that measure, transmit, and sometimes analyze energy use. They may track electricity, gas, heating, or individual equipment. A smart meter can show a building’s total demand, while circuit sensors reveal which rooms or machines drive peaks. Small gateways collect readings and send them to a dashboard or building system. The scope includes hardware, communication links, software, and the people interpreting the data. That distinction matters.
A useful system records readings at a suitable interval, such as every 15 minutes, and labels them by location or equipment. A facilities manager might compare a workshop’s overnight load with its usual baseline. A compressor cycling through the night may deserve inspection. These devices do not automatically prove waste or identify its cause. Sensor placement, calibration, network gaps, and changing schedules can distort the picture. Some measurements are estimates, not exact billing data. Even clean graphs can mislead. Energy monitoring also differs from control: a sensor reports usage, while a separate controller may change settings when properly configured and tested. A practical definition includes what is measured, how often readings arrive, and whether the data is reliable enough for a specific decision.
Key Components and Measurements
An IoT energy-monitoring device usually combines sensors, a processing unit, and a communication link. Current sensors, often clipped around a cable, detect how much electricity a circuit draws. Voltage measurements add context, allowing the device to estimate power rather than report current alone. Some systems also measure frequency and power factor. Small details matter.
Measurements commonly include instantaneous power in watts and accumulated energy in kilowatt-hours. A dashboard might show a heater drawing 1.8 kilowatts, then track its use across the day. Sampling rate affects what appears: slow readings can miss brief spikes, while frequent measurements create more data to manage. A gateway or built-in network connection sends readings to local software or a remote service. Check sensor placement and calibration; a clamp fitted backward or around multiple conductors can produce misleading results. Even good equipment has limits. Standby loads may be too small for some sensors to measure reliably, and estimated values are not the same as utility-grade readings. Reviewing unusual jumps against actual equipment use is a practical way to catch errors, though it takes patience.
How These Devices Collect and Transmit Energy Data
What Are IoT Devices for Energy Monitoring?
IoT energy monitors use sensors to track electrical use at a circuit, machine, or building level. A current transformer may clip around a cable without interrupting power. Voltage sensors provide another measurement; together, readings help estimate power and energy consumption. The device samples these signals at set intervals and attaches timestamps, so users can compare demand across hours or days. Some units also measure temperature or power quality. Details depend on the hardware. A poorly placed sensor can make accurate-looking data misleading.
The monitor processes readings locally, then sends them to a gateway or online system. Common connections include Wi-Fi, Ethernet, and cellular networks; some devices use low-power wireless links to reach a nearby gateway. Data may travel every few seconds, or in batches to reduce network use. If the connection drops, local memory can hold readings until service returns. That helps, but it is not foolproof. A full buffer may lose older records. Still, readings are not truth. Loose clamps, incorrect setup, or clock drift can distort a chart. Checking sensor placement and comparing totals with a utility meter can reveal problems before decisions rely on them.
Common Applications Across Homes and Industries
IoT energy-monitoring devices connect smart meters, plug-level sensors, thermostats, and equipment monitors to show when and where electricity is used. In homes, a meter can reveal a heating system running overnight or a refrigerator cycling too often. Room sensors help residents adjust heating and cooling around actual occupancy. The International Energy Agency’s 2023 Buildings report says buildings account for about 30% of global final energy consumption. Small, persistent loads matter.
In factories and commercial facilities, sensors track power use in motors, compressors, boilers, and production lines. A sudden rise in a motor’s draw may point to friction, a blocked filter, or a maintenance issue. Operators can compare shifts and machines, then schedule checks before faults become costly. The IEA reports that industry represented about 37% of global final energy use in 2022, making better visibility valuable—but monitoring alone does not guarantee lower consumption.
Data needs context. A busy production day can look inefficient beside a quiet one, even when equipment performs normally. Not every alert helps. Reliable systems pair readings with operating schedules, equipment details, and human review; otherwise, teams may chase noise or overlook a faulty sensor. The imperfect part is often not the device, but how people interpret its numbers.
Benefits, Limitations, and Security Considerations
What Are IoT Devices for Energy Monitoring? Benefits, Limitations, and Security Considerations
IoT energy-monitoring devices use connected meters, sensors, and software to show electricity use by circuit, machine, or room. Facility teams can spot an air-conditioning unit running after hours or compare a production line’s shift-to-shift consumption. The International Energy Agency’s 2023 Global Status Report for Buildings and Construction says buildings account for about 30% of global final energy use. Better visibility can help operators find waste, check whether upgrades work, and respond to unusual demand. But readings do not save energy by themselves.
Accuracy and coverage vary. A sensor may miss loads, drift over time, or report data late when a network drops. Installation and integration can also take more effort than expected. Security deserves equal attention: each connected meter adds a device, account, or data path that must be maintained. Limit access, change default credentials, apply updates, and separate monitoring devices from critical control systems where practical. Treat fine-grained usage data as sensitive; it can reveal occupancy patterns. A polished dashboard can still give a false sense of certainty.
Tip: Compare device readings with a trusted meter before acting. Record a baseline, check sensor placement, and review access logs regularly. Keep one manual check in the routine.
What Are IoT Devices for Energy Monitoring? Benefits, Limitations, and Security Considerations
| Device Type | Typical Data Monitored | Typical Update Pattern | Potential Benefits | Limitations | Security Considerations |
|---|---|---|---|---|---|
| Connected electricity meter | Electricity consumption in kWh; some meters also report demand in kW, voltage, or outage events. | Often collected in intervals such as 15, 30, or 60 minutes; availability depends on the meter and utility service. | Helps users compare usage over time, identify high-consumption periods, and support demand-management programs. | May not show which individual appliance is using energy. Data access and reporting frequency can depend on the utility. | Protect account credentials and restrict access to meter data, which can reveal occupancy patterns. Use authenticated, encrypted data connections. |
| Whole-home or whole-building circuit monitor | Current and estimated power or energy use across a main supply or selected electrical circuits. | Measurements may be taken several times per second, while dashboards commonly display summaries at longer intervals. | Can provide more timely feedback than monthly bills and help detect unusual load changes or after-hours consumption. | Installation may require work inside an electrical panel. Readings can be affected by sensor placement, calibration, and electrical system configuration. | Secure the gateway and administrator account; keep device firmware updated and separate monitoring equipment from less-trusted network devices where practical. |
| Connected outlet or plug-level monitor | Power and cumulative energy use for a single plugged-in appliance; some models also report voltage or current. | Usually reports periodically, with the interval varying by device settings, network connection, and power-saving features. | Offers appliance-level visibility without monitoring an entire building and can help identify standby or unexpectedly high consumption. | Only measures compatible plug-in loads. It may not be suitable for high-power equipment, hardwired appliances, or loads exceeding its rating. | Use a unique password and supported software updates. Review permissions for any associated app and avoid exposing remote-control features unnecessarily. |
| Building submeter with network connectivity | Electricity consumption for a tenant, floor, equipment group, or other separately metered area; some systems also track peak demand. | Commonly records interval data, often every 15 minutes, though shorter or longer intervals are possible. | Supports energy allocation, benchmarking, and identification of areas with persistently high consumption. | Requires appropriate metering infrastructure and careful configuration. Comparisons can be misleading if areas have different uses or operating hours. | Limit data access by role, protect communications between meters and management systems, and retain only the data needed for operations. |
| HVAC equipment or building-control monitor | Equipment operating status, runtime, temperature, setpoints, and, when paired with suitable meters, electricity use. | Status and sensor readings may update from seconds to several minutes, depending on the control system and application. | Helps relate energy use to schedules and operating conditions, and can reveal equipment running outside expected hours. | Temperature or runtime alone does not directly measure energy consumption. Poor sensor placement or incorrect schedules can produce misleading conclusions. | Protect control-system access, use separate network zones where feasible, and carefully restrict remote commands that can affect building operation. |
| Solar inverter or battery monitor | Solar generation, battery charge and discharge, state of charge, and grid import or export when compatible meters are installed. | Values are commonly refreshed from seconds to minutes; stored reporting intervals vary by system configuration. | Helps users compare generation, consumption, and storage behavior and understand when energy is imported from or exported to the grid. | Readings may not represent total building consumption unless the system includes suitable site-level metering. Performance depends on correct configuration. | Use authenticated access, secure wireless settings, and timely firmware updates. Restrict remote control and protect data linked to household routines. |
